See the story behind
your workforce data
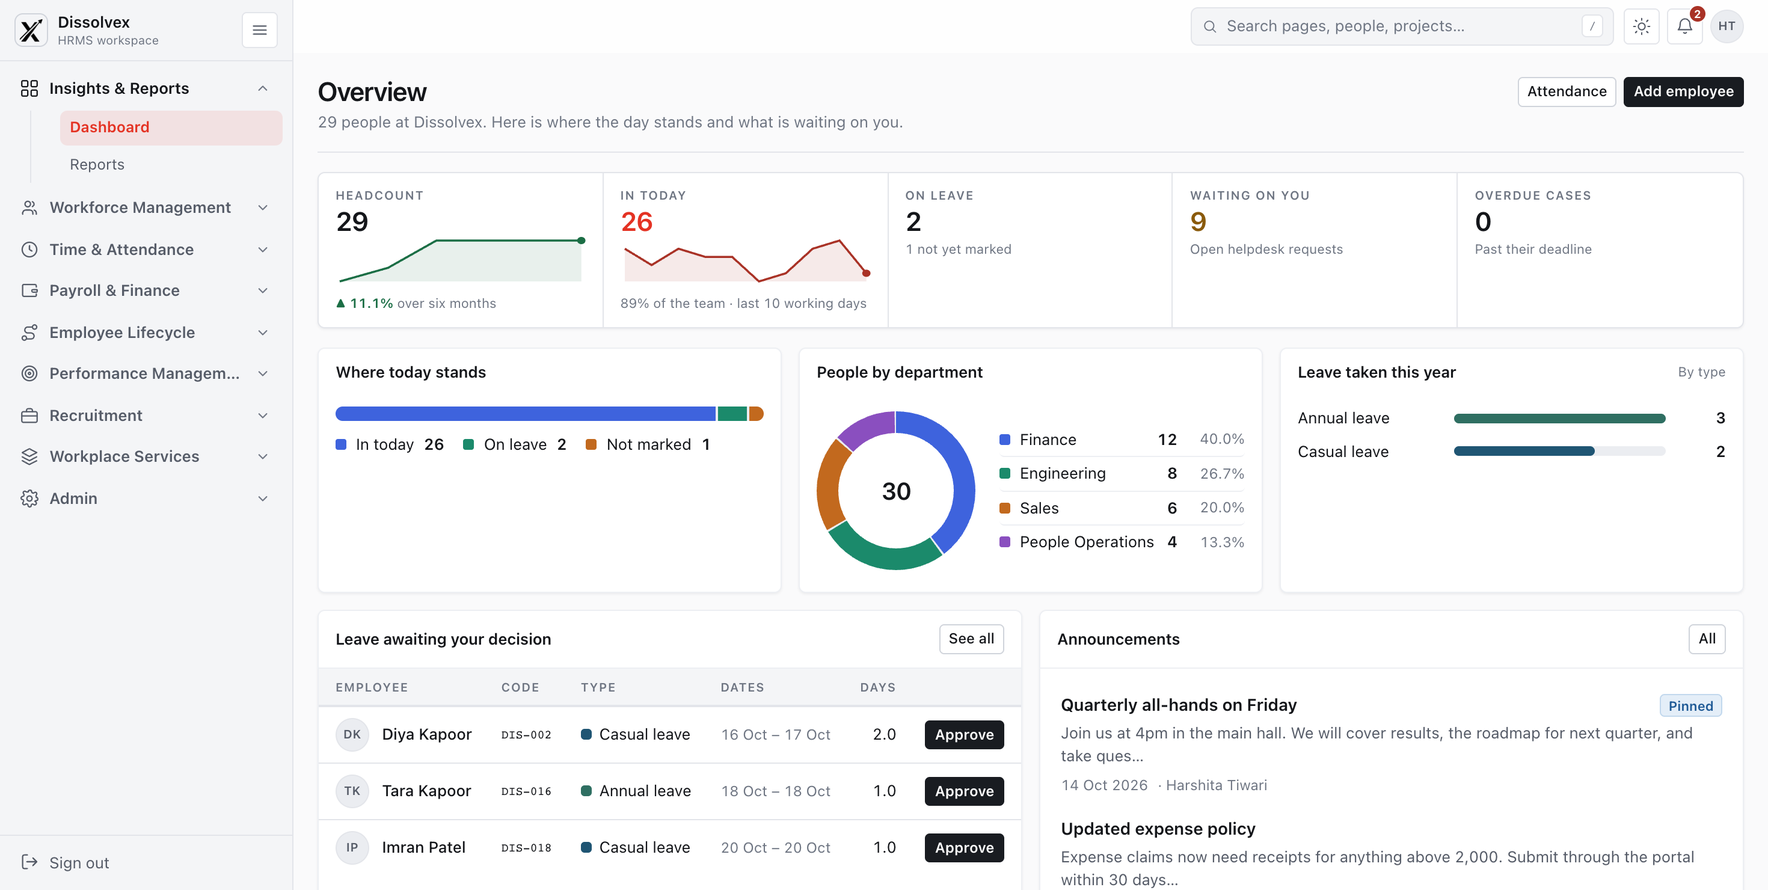
Bring workforce information together in dashboards that help leaders understand headcount, attendance, turnover, and other people trends.
Give each team a useful
view of people data
Give employees, managers, and HR leaders views of the metrics relevant to their work without waiting for manual exports.
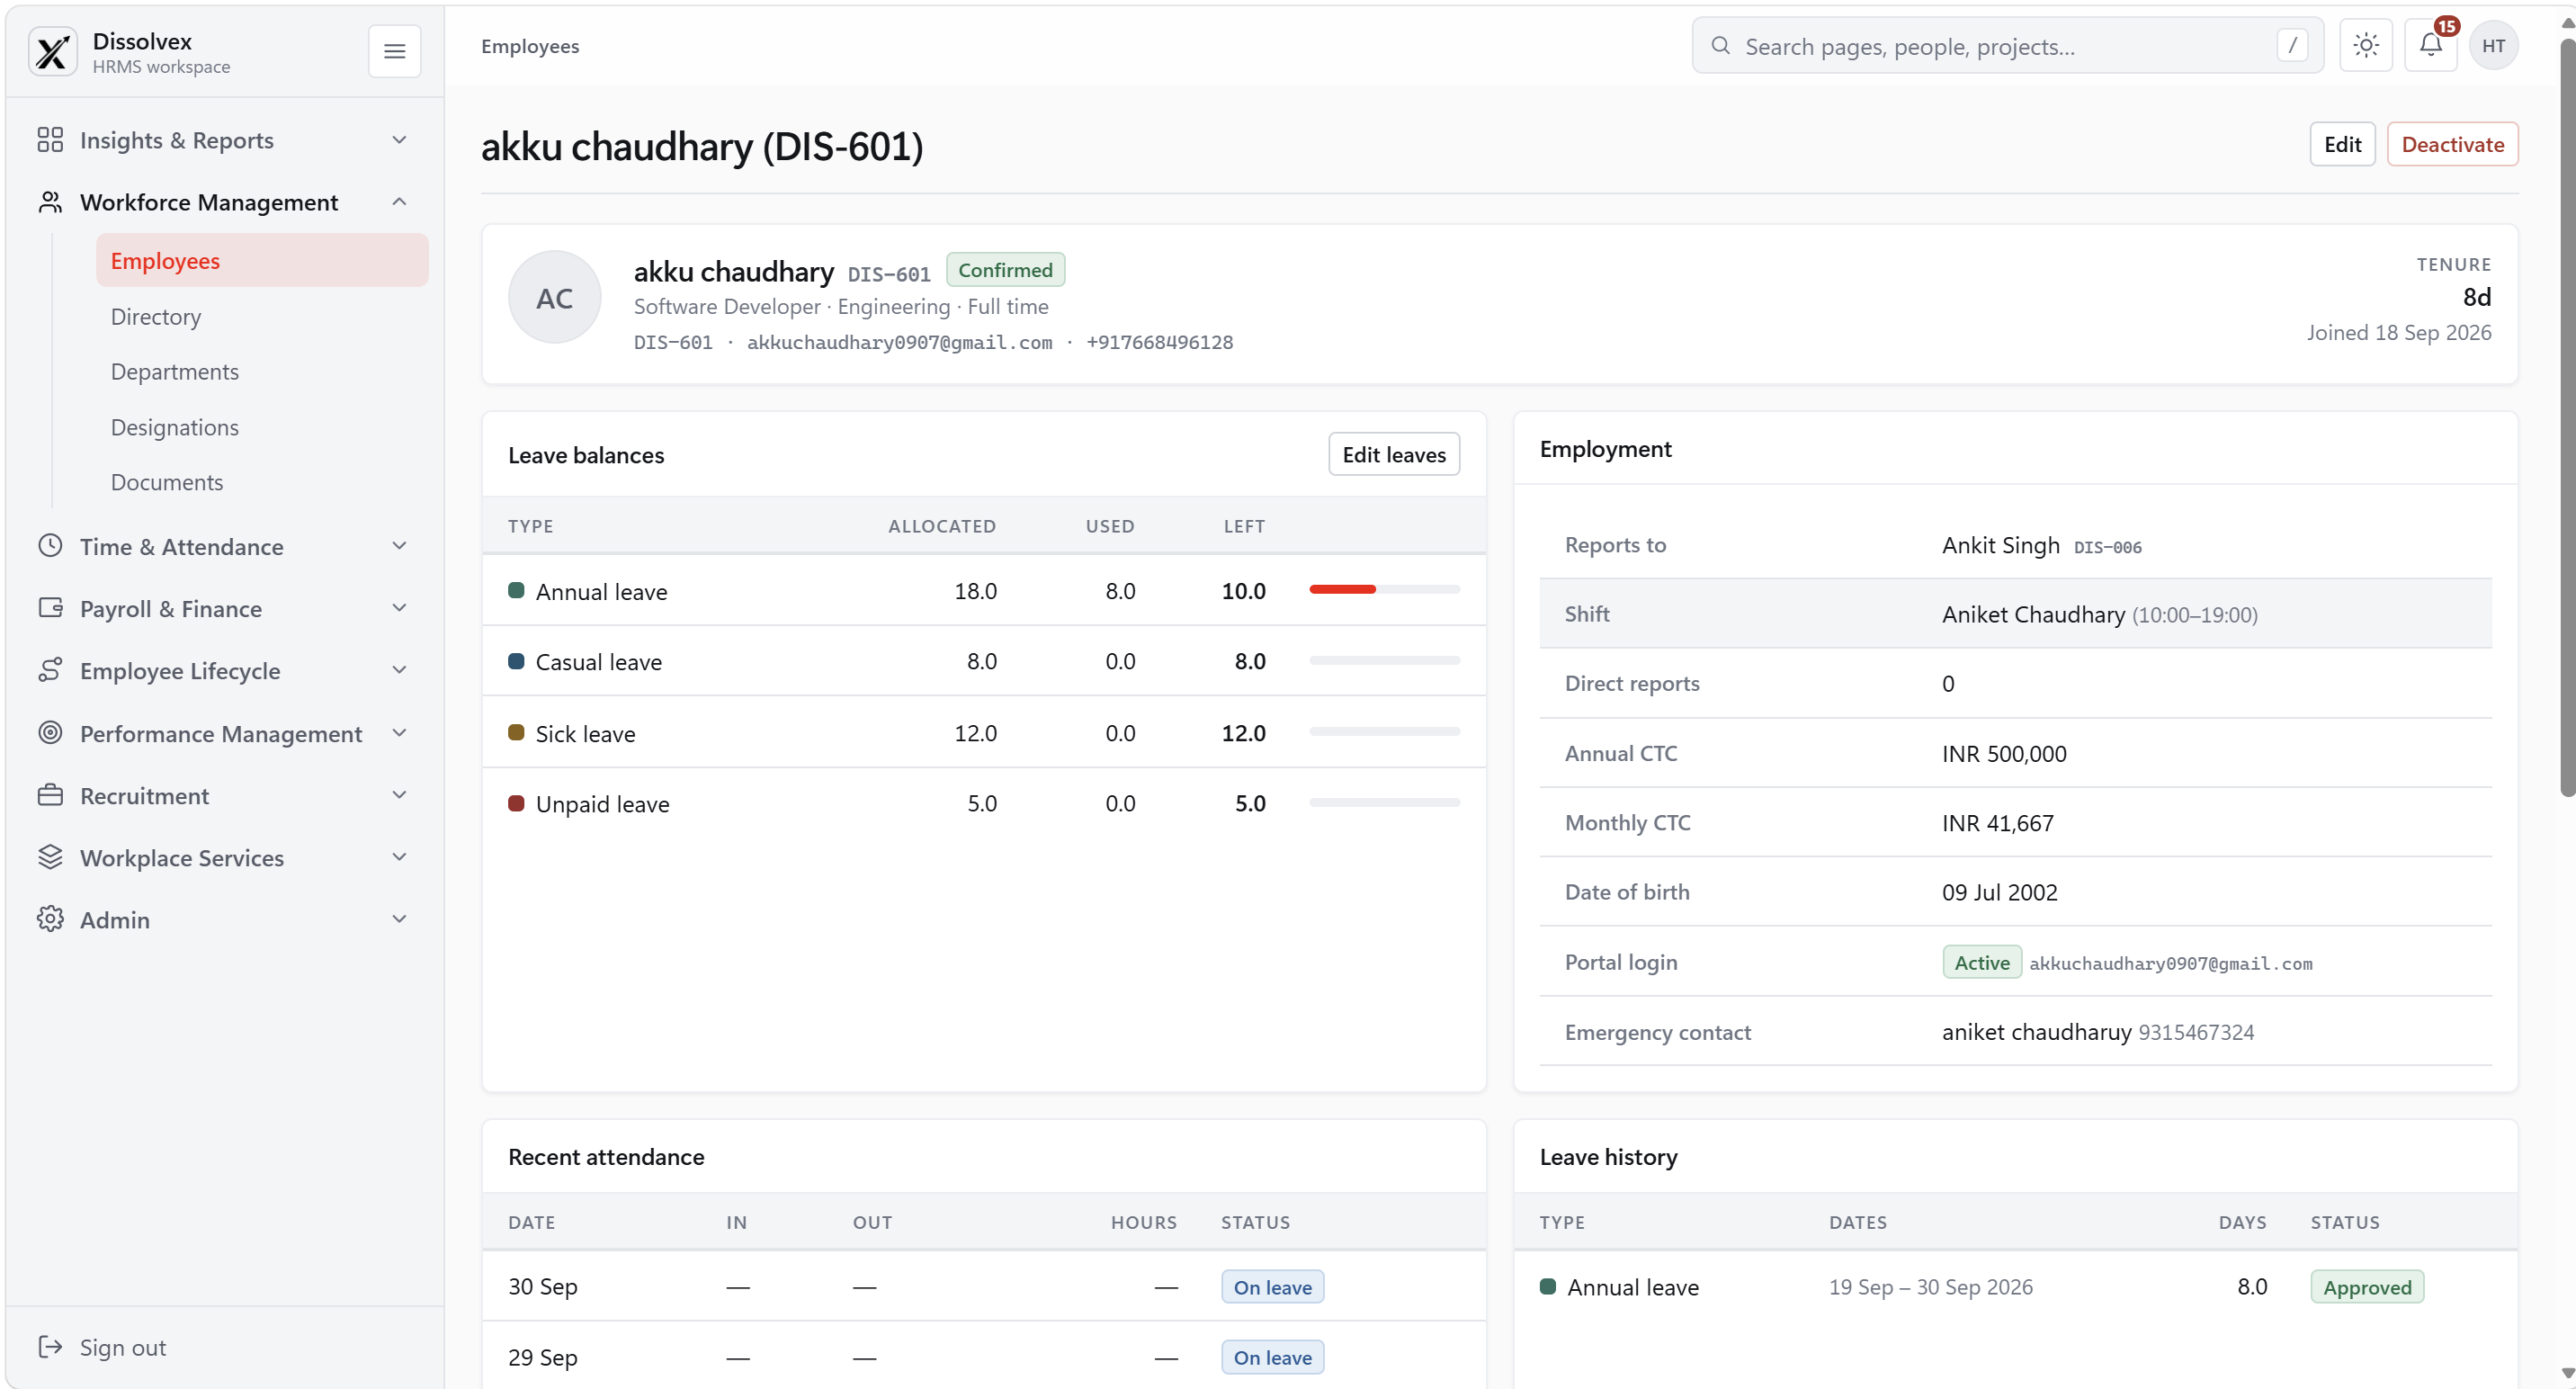
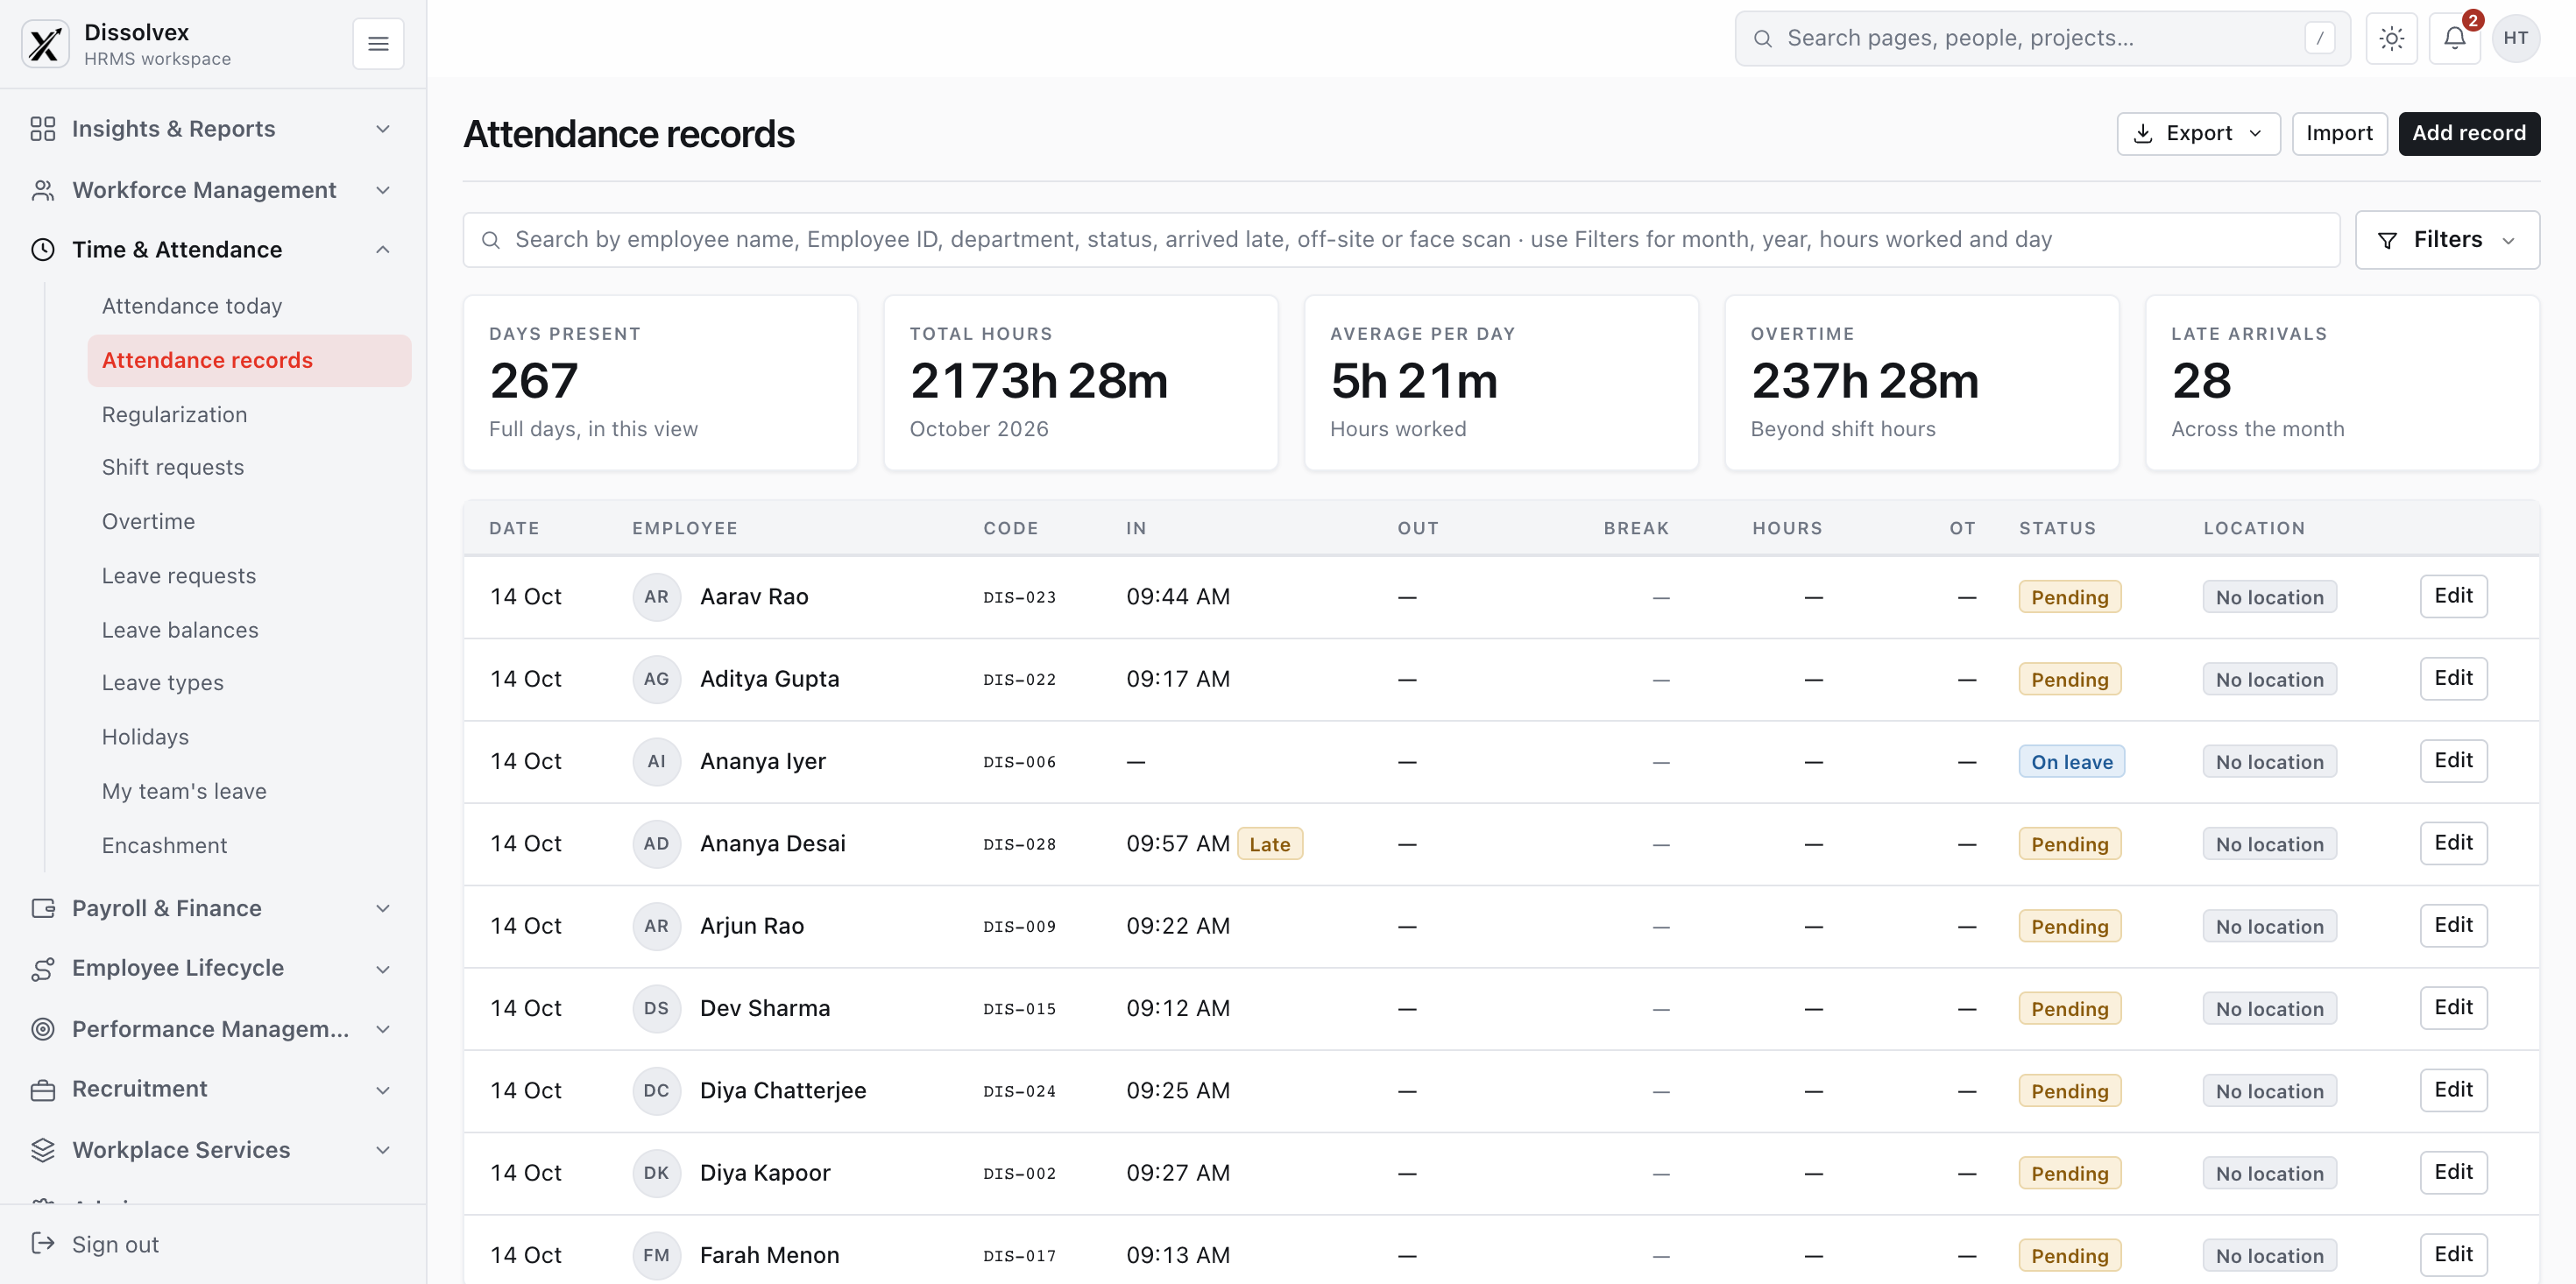
Company-Wide Strategic Workforce Intelligence
Leadership dashboards bring headcount and retention trends into focus.
Build reports around the
questions you have
Choose the measures and workforce dimensions you need, then build a visual report around a specific question.
Choose the measures that answer your question
Select relevant fields and compare related measures in a report.
Multi-Layered Granular Filters
Use department, tenure, location, and role filters to narrow a broad trend.
Automated Scheduled Dispatches
Share a report with its period, filters, and source context so readers can interpret the figures.
| Department | Headcount | Avg Tenure | Overtime Hours | Retention Rate |
|---|---|---|---|---|
| Engineering | 412 | 3.8 Yrs | 124 hrs | 96.4% |
| Product & Design | 138 | 3.2 Yrs | 32 hrs | 95.1% |
| Customer Success | 245 | 2.9 Yrs | 58 hrs | 93.8% |
| Sales & Growth | 210 | 2.4 Yrs | 86 hrs | 91.5% |
Move from the overview
to the details
Move from organization-wide patterns into teams and cohorts to understand what is driving change.
Compare hiring and departures
Compare hiring and departures over the period you choose to understand workforce movement.
Follow workforce growth
Follow headcount changes across teams and time periods.
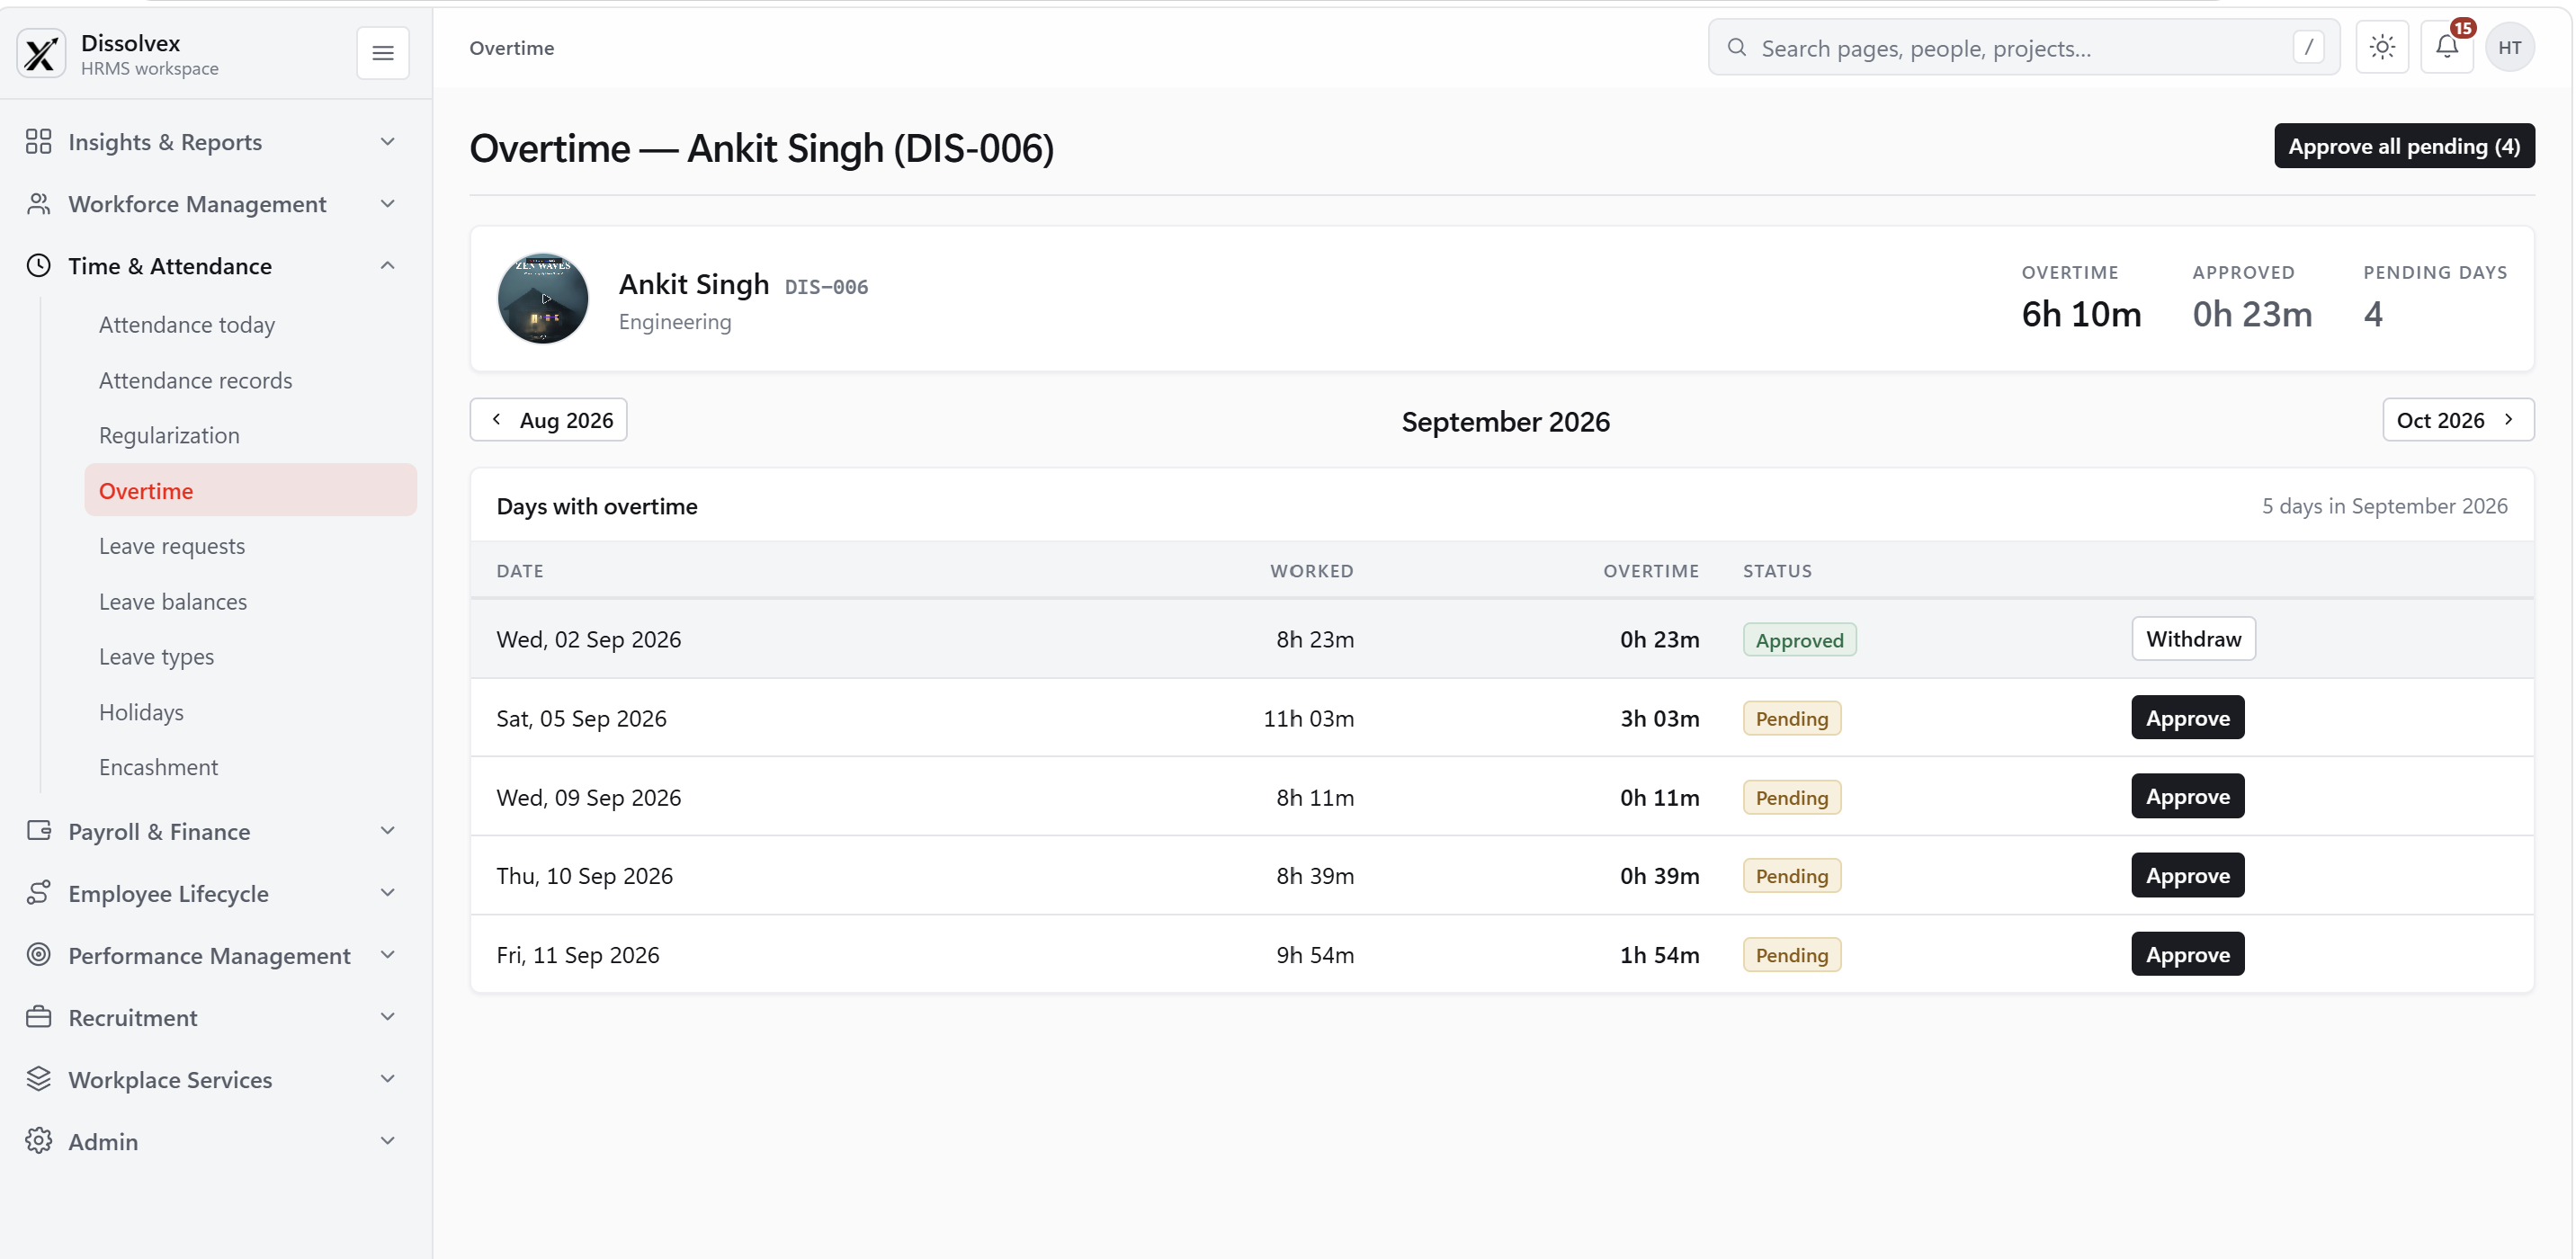
Understand working time
Review recorded time, billable hours, and differences from project estimates.
Track work status
See how many tasks are assigned, complete, or overdue.
Explore employee records
Explore workforce composition by role, location, tenure, and other relevant dimensions.
Prepare EEO reporting
Prepare EEO information from the employee records required for reporting.
Frequently Asked Questions
Find answers to common questions about HR analytics, people reporting, statutory compliance, and workforce intelligence in dissolveX HRMS.
How to connect & get started?
Login to your account →Reporting describes workforce activity; people analytics uses that information to examine patterns and guide decisions.
It can combine data from workforce, recruitment, attendance, and other HR workflows into charts and reports.
Teams can examine hiring, retention, time, performance, and workforce composition from different angles.
- Hiring: Where do candidates spend the most time in the recruitment process?
- Capacity: Which teams are growing, and where is workload changing?
- Development: Are review goals and learning activities progressing?
- Pay: How do compensation patterns vary across comparable roles?
- Experience: What themes recur in employee feedback?
It helps leaders notice changes early, compare teams fairly, and plan with a clearer view of the workforce.
- Locate hiring delays. Compare stages of recruitment to find where applications wait and where follow-up is needed.
- Plan with context. Review headcount, workload, and current skills together before proposing new roles or training.
- Focus development discussions. Bring goal progress and feedback into conversations about support, learning, and realistic expectations.
- Investigate departures. Compare turnover across periods and teams, then discuss possible causes rather than treating a chart as an explanation.
- Follow up on feedback. Look at participation and recurring survey themes, choose an improvement, and check the next round for change.
dissolveX provides dashboards and configurable reports that let teams move from a summary to the underlying detail.
- Start with a relevant view. Employees review their own work, managers review team activity, and HR teams examine organization-wide patterns within their permissions.
- Narrow the question. Select a period and available filters to focus the report on the team or process you are reviewing.
- Share the context. Include the reporting period and scope when discussing a result so others understand what the figures represent.
Yes. Reports can be filtered by the workforce dimensions available in the underlying HR records.